Introduction to Chart Patterns
In the world of stock market analysis, chart patterns play a crucial role in helping traders decipher the market’s movements. These patterns are visual representations of price movements plotted over time, providing valuable insights into potential future price trends. Understanding different types of chart patterns is essential for making informed trading decisions and maximizing profits.
What are Chart Patterns?
Chart patterns are formations that appear on price charts, representing the behavior of market participants over a certain period. They are formed by the movement of a security’s price and are categorized based on their shape and the implications they hold for future price action. Traders use these patterns to identify potential entry and exit points, as well as to gauge the strength of a trend.
Importance of Understanding Chart Patterns in the Stock Market
Mastering chart patterns is akin to learning the language of the stock market. It allows traders to interpret price movements more effectively, anticipate market reversals, and capitalize on emerging trends. By recognizing these patterns, traders can gain a competitive edge and make well-informed decisions in their trading journey.
Types of Chart Patterns
Head and Shoulders
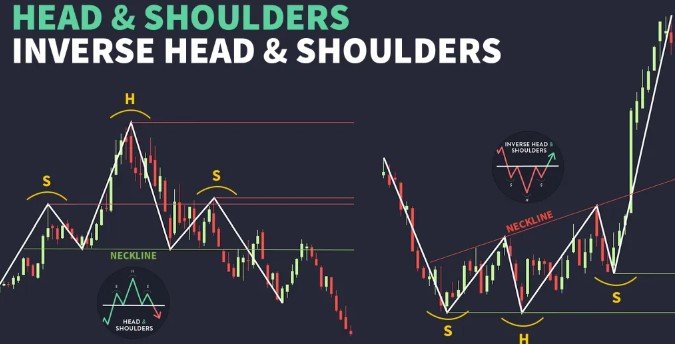
The head and shoulders pattern is a classic reversal formation that signals a potential trend change.It comprises of three peaks: a central peak (the head), flanked by two smaller peaks (the shoulders).. This pattern indicates exhaustion of the current trend and a possible reversal in the opposite direction.
Double Top and Double Bottom
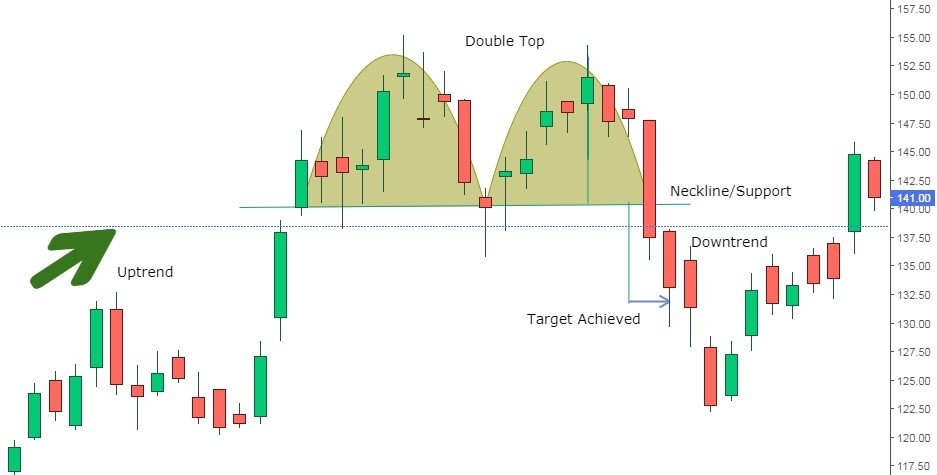
Double top and double bottom patterns occur when the price reaches a peak or trough twice, but fails to break through the previous high or low. These patterns signal a potential reversal of the prevailing trend, with the double top indicating a bearish reversal and the double bottom indicating a bullish reversal.
Triangles
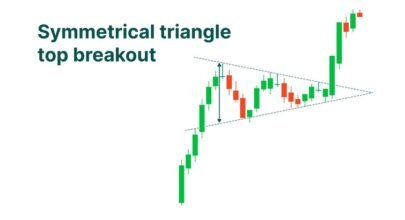
Triangles are continuation patterns formed by converging trendlines, indicating a period of consolidation before the continuation of the existing trend. There are three main types of triangles – ascending, descending, and symmetrical – each with its own implications for future price movements.
Flags and Pennants
Flags and pennants are patterns that occur after a significant price movement. Flags have a rectangular shape, while pennants are small, symmetrical triangles.These patterns signal a brief pause in the market before the resumption of the previous trend.

Cup and Handle
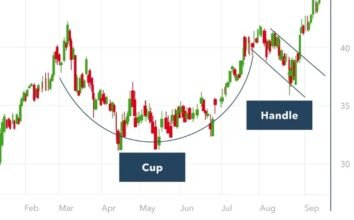
The cup and handle pattern is a bullish continuation formation characterized by a rounded bottom (the cup) followed by a smaller consolidation (the handle). This pattern indicates a temporary pause in the uptrend before the resumption of bullish momentum.
Wedges
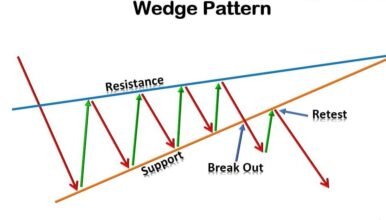
Wedges are triangular patterns that are sloping in nature, with either a rising or falling slope. Rising wedges are bearish formations, indicating a potential reversal, while falling wedges are bullish formations, signaling a potential continuation of the uptrend.
Rectangles
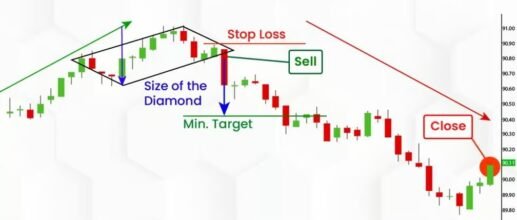
Rectangles are consolidation patterns characterized by parallel trendlines, indicating a period of indecision in the market. These patterns can serve as both continuation and reversal signals, depending on their context within the broader trend.
Saucers
Saucers, also known as rounding bottoms, are long-term reversal patterns that resemble a shallow bowl. They indicate a gradual shift from a downtrend to an uptrend, signaling a potential reversal in market sentiment.

Gaps
Gaps occur when there is a noticeable break in the price movement of a security, resulting in a gap between two consecutive trading sessions. There are several types of gaps, including breakaway, runaway, and exhaustion gaps, each with its own implications for future price action.

Importance of Chart Patterns in Trading
Chart patterns serve as valuable tools for traders, providing insights into market sentiment and potential future price movements. By identifying and interpreting these patterns, traders can make more informed decisions, manage risk effectively, and capitalize on trading opportunities.
Common Mistakes to Avoid
While chart patterns can be powerful indicators, they are not foolproof and should be used in conjunction with other forms of analysis. Some common mistakes to avoid include:
- Over-reliance on chart patterns without considering other factors such as fundamental analysis and market context.
- Ignoring the broader market environment and relying solely on isolated patterns.
- Failing to adapt to changing market conditions and sticking to outdated trading strategies.
Conclusion
In conclusion, chart patterns are invaluable tools for traders seeking to navigate the complexities of the stock market. By understanding the various types of chart patterns and their implications, traders can gain a deeper insight into market dynamics and make more informed trading decisions. However, it is essential to approach chart patterns with caution and use them in conjunction with other forms of analysis for optimal results.


